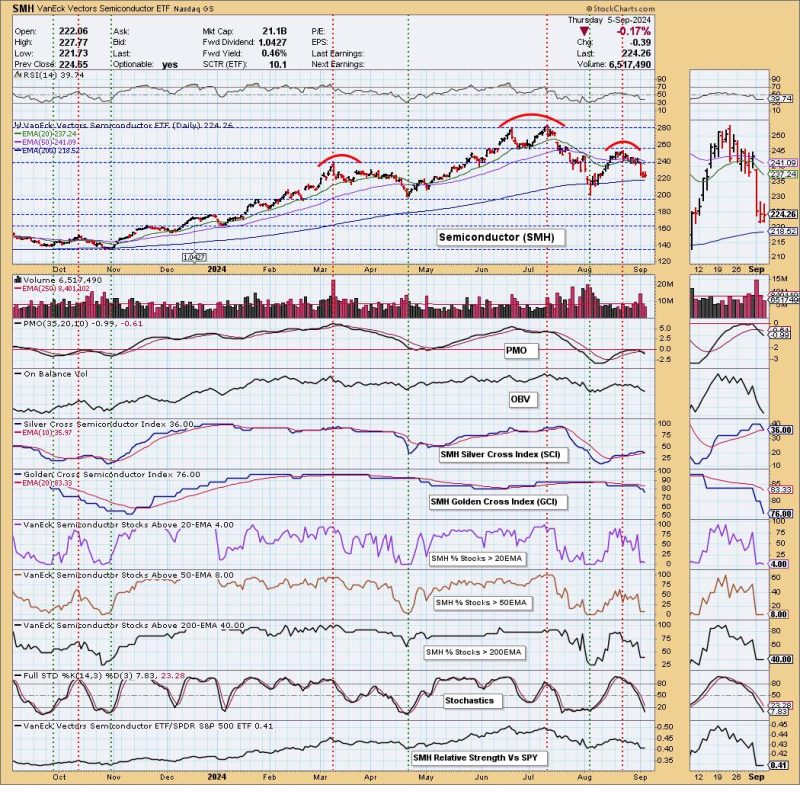
Semiconductor Sector Facing Bearish Head and Shoulders Formation
The semiconductor sector, crucial in today’s technological advancement, is currently experiencing a significant technical pattern that could indicate a shift in the market sentiment. The chart analysis reveals a bearish head and shoulders formation on the SMH (VanEck Vectors Semiconductor ETF), suggesting a potential downtrend in the intermediate term. Let’s delve deeper into this pattern and its implications for investors.
Head and shoulders patterns are well-known technical formations characterized by three peaks – a higher peak (head) in the middle and two lower peaks (shoulders) on either side. The neckline, a level of support, connects the lows between the peaks. In the case of the semiconductor sector, the SMH chart displays a classic head and shoulders pattern, signifying a potential trend reversal from bullish to bearish.
The left shoulder formed in early February, followed by the head peak in mid-February, and the right shoulder in early March. The neckline, now a critical support level, runs approximately at $220. A decisive break below this level could trigger a bearish momentum in the semiconductor sector, with a downside target projected by measuring the distance from the head to the neckline.
Moreover, the volume analysis plays a crucial role in validating the pattern. Ideally, the volume should decrease as the pattern evolves, indicating a loss of buying momentum. If the volume surges upon breaking the neckline, it would further confirm the bearish outlook for the semiconductor sector.
Additionally, it’s essential to consider the broader market context and fundamental factors impacting the semiconductor industry. Global supply chain disruptions, ongoing chip shortages, and geopolitical tensions can significantly influence the sector’s performance. Investors should stay vigilant and align their investment strategies accordingly in response to these external factors.
As for potential trading strategies, conservative traders may wait for a confirmed break below the neckline before initiating short positions. The stop-loss levels should be set above the right shoulder to mitigate risks in case of a false breakdown. On the other hand, more aggressive traders might consider shorting the sector upon a close below the neckline, anticipating a swift downward move.
In conclusion, the bearish head and shoulders pattern on the semiconductor sector’s chart is a notable development that investors should closely monitor. While technical analysis provides valuable insights, combining it with a comprehensive understanding of market dynamics and industry fundamentals can enhance decision-making. By staying informed and adapting to changing market conditions, investors can navigate the evolving landscape of the semiconductor sector effectively.
