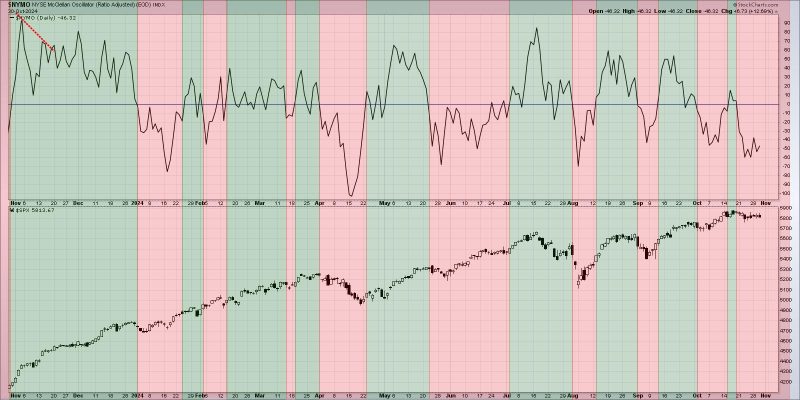
In technical analysis, breadth divergences have long been regarded as important signals that provide insight into market trends and potential reversals. These divergences occur when financial assets move in different directions, indicating underlying weakness or strength in the markets. Traders and investors often analyze breadth divergences to anticipate shifts in market sentiment and make informed decisions about their portfolios.
There are various types of breadth divergences that traders monitor to gauge the health of the market. One common type is price-volume divergences, where the price of an asset moves in one direction while trading volume moves in the opposite direction. This divergence suggests that the price movement may not be sustainable and could potentially reverse in the near future.
Another type of breadth divergence is sector divergence, which occurs when different sectors within the market exhibit conflicting performance. For example, if technology stocks are rallying while consumer staples are declining, this could be a sign of sectoral weakness that may impact the broader market.
Market breadth indicators are also crucial tools for identifying breadth divergences. These indicators track the number of advancing and declining assets in a given market, providing valuable information about market participation and overall strength. A decline in market breadth, where fewer assets are participating in a market rally, can signal a lack of conviction among investors and a potential reversal in the market trend.
Analyzing breadth divergences requires a comprehensive understanding of market dynamics and technical analysis tools. Traders often use a combination of breadth indicators, price charts, and sector analysis to identify divergences and confirm their trading decisions. By monitoring these divergences, traders can stay ahead of market trends and adjust their strategies accordingly.
While breadth divergences can provide valuable insights into market trends, it is essential to exercise caution and consider other factors before making trading decisions. Divergences are not foolproof indicators and can sometimes be misleading, leading to false signals. Traders should use breadth divergences as part of a broader trading strategy and combine them with other technical and fundamental analysis tools for a more comprehensive view of the market.
In conclusion, breadth divergences play a significant role in technical analysis and can offer valuable signals about market trends and potential reversals. Traders and investors who understand how to interpret these divergences can make more informed decisions and navigate the markets with greater confidence. By staying vigilant and incorporating breadth analysis into their trading strategies, market participants can adapt to changing market conditions and capitalize on emerging opportunities.
