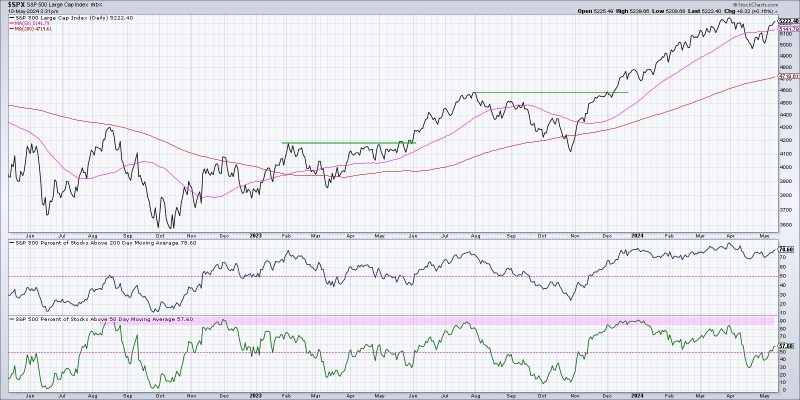
In the world of financial markets and investing, being able to identify a bullish trend can be a valuable skill for traders and investors alike. A bullish market trend is characterized by rising prices and overall optimism among participants. While there are many ways to analyze market trends, breadth indicators provide an insightful perspective that can help confirm a bullish market trend. Here are three breadth indicators that can be useful in evaluating the strength of a bullish market trend.
1. **Advance-Decline Line (A/D Line)**
The Advance-Decline Line is a breadth indicator that measures the difference between advancing and declining stocks over a specific period. A rising A/D Line suggests that more stocks are advancing than declining, indicating broad market strength. In a bullish market trend, the A/D Line should also be trending upwards, reflecting the overall positive sentiment among market participants.
Traders and investors often use the A/D Line to confirm the strength of a market rally or identify potential reversals. If the A/D Line is moving higher while prices are also rising, it suggests that the bullish trend is supported by a broad-based increase in the number of advancing stocks.
2. **New Highs-Lows Index**
The New Highs-Lows Index measures the number of stocks reaching new highs versus those hitting new lows over a specific period. A high level of new highs relative to new lows is typically seen in a bullish market environment, as it indicates increased buying interest and strength in the market.
By monitoring the New Highs-Lows Index, traders can gauge the breadth of the market rally and confirm the sustainability of the bullish trend. A widening divergence between new highs and new lows suggests that the market is healthy and that the bullish momentum is likely to continue.
3. **Volume Confirmation**
Volume is an essential factor in confirming market trends, including bullish trends. In a bullish market trend, increasing trading volume can indicate strong conviction among buyers and validate the upward price movement. High volume on up days and lower volume on down days is a sign of healthy market breadth and suggests that the trend is well-supported.
Traders often look for volume confirmation to ensure that the bullish trend is sustainable and supported by market participants. A lack of volume on rallies could signal weakness in the trend and potential reversal, highlighting the importance of monitoring volume alongside price movements.
In conclusion, breadth indicators play a crucial role in confirming a bullish market trend by providing insights into the overall strength and breadth of the market rally. By paying attention to indicators such as the Advance-Decline Line, New Highs-Lows Index, and volume confirmation, traders and investors can make more informed decisions and better navigate the complexities of the financial markets. Understanding and utilizing these breadth indicators can help market participants navigate bullish trends with greater confidence and efficiency.
