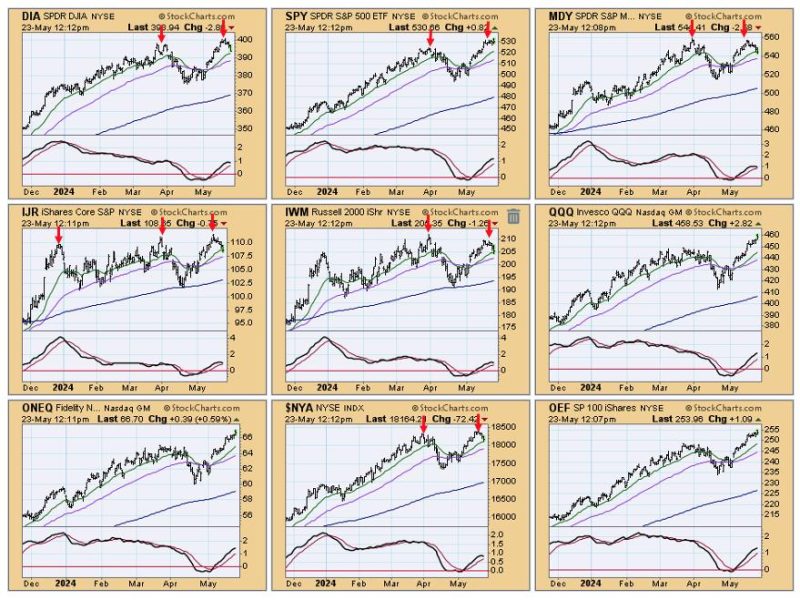
As businesses and investors continue to navigate the ever-changing landscape of the global economy, one question that often arises is whether the market is reaching a tipping point. The concept of a toppy market, where prices may have reached unsustainable levels and could be poised for a correction, is a concern that weighs on the minds of many in the financial world. Let’s delve into the key indicators and factors that may suggest the market is indeed looking toppy.
**Valuation Metrics:** The valuation of assets is one of the most essential indicators of market health. When valuations become stretched, it could indicate that prices have outpaced underlying fundamentals. Metrics such as price-to-earnings ratios, price-to-sales ratios, and dividend yields can offer valuable insights into whether the market is overvalued.
**Market Sentiment:** Investor sentiment plays a crucial role in driving market movements. Excessive optimism or pessimism can lead to irrational behavior and asset bubbles. If the general sentiment among investors is overwhelmingly positive, it may be a sign that the market is entering frothy territory.
**Volatility:** Market volatility, as measured by indicators like the VIX, can provide clues about investor uncertainty and the potential for sudden price swings. A sharp increase in volatility could indicate that market participants are becoming jittery and could signal an impending correction.
**Corporate Earnings:** The performance of companies is a fundamental driver of stock prices. If corporate earnings growth starts to falter or companies begin to issue profit warnings, it could be a red flag that the market is approaching a top.
**Central Bank Policies:** Monetary policies set by central banks have a profound impact on financial markets. Accommodative policies like low interest rates and quantitative easing can inflate asset prices and create a sense of complacency among investors. If central banks begin to tighten monetary policy, it could trigger a reassessment of risk assets and lead to a market correction.
**Technical Indicators:** Chart analysis and technical indicators can provide valuable insights into market trends and potential turning points. Patterns like double tops, head and shoulders formations, and overbought conditions on indicators like the Relative Strength Index (RSI) could suggest that the market is ripe for a pullback.
In conclusion, while no single indicator can definitively predict market movements, a combination of valuation metrics, sentiment analysis, volatility measures, corporate earnings, central bank policies, and technical indicators can offer valuable insights into the health of the market. As investors and market participants monitor these factors closely, it is essential to remain vigilant and prepared for potential shifts in market dynamics. By staying informed and exercising prudent risk management, individuals can navigate potential market toppy scenarios with greater confidence and resilience.
