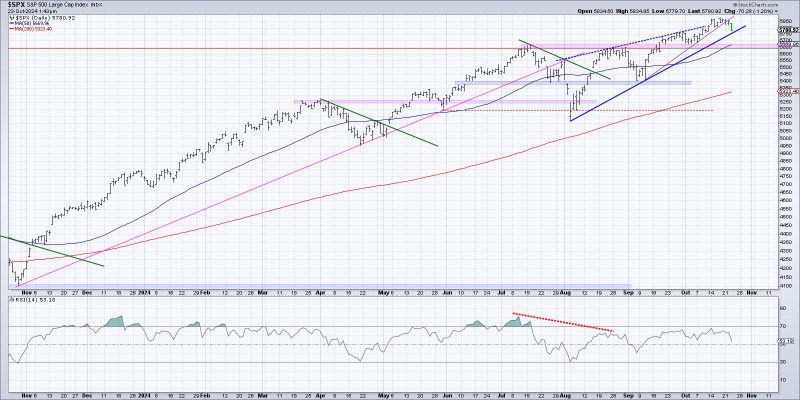
Visualizing the start of a potential distribution phase in the stock market can be a valuable tool for investors seeking to make informed decisions. By analyzing key indicators and patterns, traders can gain valuable insights into market dynamics and better anticipate potential shifts in price movements. In this article, we explore three effective ways to visualize the beginning stages of a distribution phase, offering practical guidance for traders looking to enhance their market analysis skills.
1. Volume Analysis:
One of the primary indicators used to identify the start of a distribution phase is volume analysis. By observing trading volume alongside price movements, traders can gain valuable insights into the strength of buying and selling pressure in the market. During the initial stages of a distribution phase, a decrease in trading volume may indicate weakening buying interest, suggesting that the market is transitioning from an accumulation phase to a distribution phase. Additionally, sudden spikes in volume, particularly on days with downward price movements, can signal increased selling activity and further support the hypothesis of a potential distribution phase.
2. Price and Trend Analysis:
Another effective method for visualizing the onset of a distribution phase is through price and trend analysis. By examining price patterns and trend lines, traders can identify key levels of support and resistance that may indicate a shift in market sentiment. During a distribution phase, prices typically exhibit a series of lower highs and lower lows, reflecting increased selling pressure and weakening market dynamics. Moreover, the formation of bearish chart patterns, such as head and shoulders or double tops, can provide further confirmation of a potential distribution phase and help traders anticipate future price movements.
3. Market Breadth Indicators:
In addition to volume and price analysis, monitoring market breadth indicators can offer valuable insights into the underlying strength of the market during a distribution phase. Breadth indicators, such as the advance-decline line and the McClellan Oscillator, track the number of advancing and declining stocks in the market, providing a broader perspective on market participation. A divergence between price movements and market breadth indicators, where the market indices are reaching new highs while the breadth indicators are weakening, can signal a potential distribution phase and suggest a lack of widespread investor conviction.
In conclusion, visualizing the start of a potential distribution phase in the stock market requires a comprehensive analysis of key indicators and patterns. By integrating volume analysis, price and trend analysis, and market breadth indicators into their trading strategies, investors can enhance their ability to identify early warning signs of a distribution phase and make more informed investment decisions. With a thorough understanding of market dynamics and nuanced analysis techniques, traders can navigate market volatility more effectively and capitalize on emerging opportunities.
