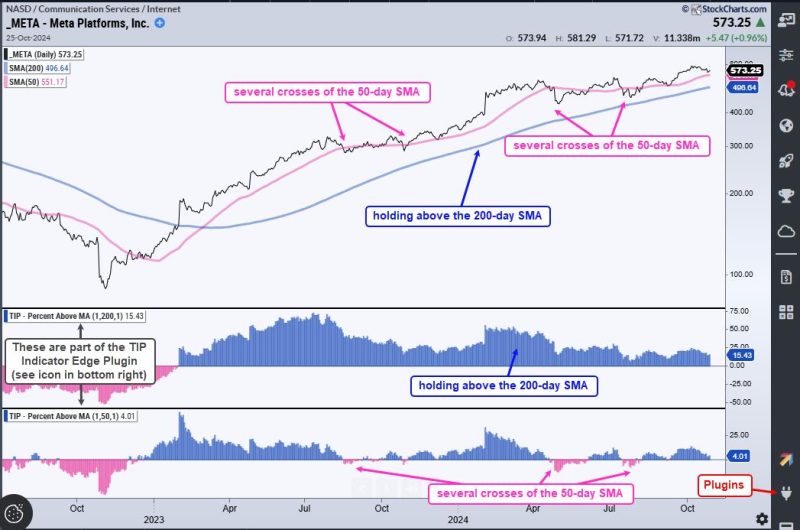
For traders and investors looking to enhance their edge in the financial markets, incorporating technical and fundamental analysis into their decision-making process is crucial. By utilizing two key indicators, the Relative Strength Index (RSI) and Moving Average Convergence Divergence (MACD), traders can gain valuable insights into market trends and potential entry and exit points for trades.
The Relative Strength Index (RSI) is a momentum oscillator that measures the speed and change of price movements. This indicator is particularly useful for identifying overbought or oversold conditions in a security. When the RSI reaches extreme levels, such as above 70 or below 30, it may signal a potential reversal in the market trend. Traders can use the RSI to make informed decisions on whether to enter or exit a trade based on these overbought or oversold conditions.
On the other hand, the Moving Average Convergence Divergence (MACD) is a trend-following indicator that shows the relationship between two moving averages of a security’s price. The MACD line is calculated by subtracting the 26-day exponential moving average (EMA) from the 12-day EMA. Additionally, the signal line is the 9-day EMA of the MACD line. When the MACD line crosses above the signal line, it may indicate a bullish trend, while a crossover below the signal line could signal a bearish trend. Traders can use the MACD to confirm market trends and identify potential entry and exit points.
By combining the insights provided by the RSI and MACD indicators, traders can improve their edge in the markets and make more informed trading decisions. These indicators can help traders identify potential reversals, confirm market trends, and enhance their overall trading strategy. By incorporating technical analysis tools such as the RSI and MACD into their trading toolbox, traders can gain a competitive advantage and improve their likelihood of success in the dynamic world of trading and investing.
